This Is Not a Gerrymander
The opposition’s favorite word is “gerrymander.” They want you to hear it and stop thinking. But gerrymandering has a real definition, and Map C does not fit it.
What Gerrymandering Actually Looks Like
Gerrymandered districts have razor-thin corridors connecting disconnected areas. They have tentacles that reach across counties to grab specific precincts. They are drawn in back rooms by politicians choosing their voters.
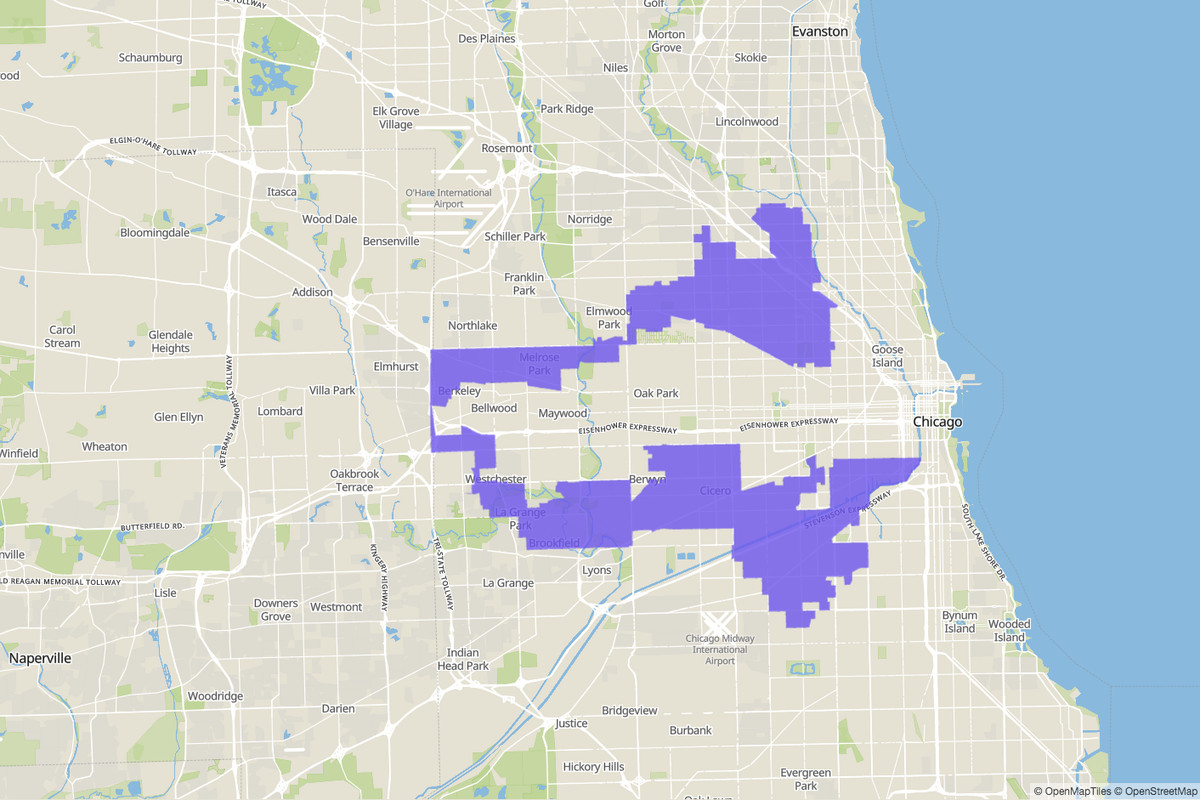
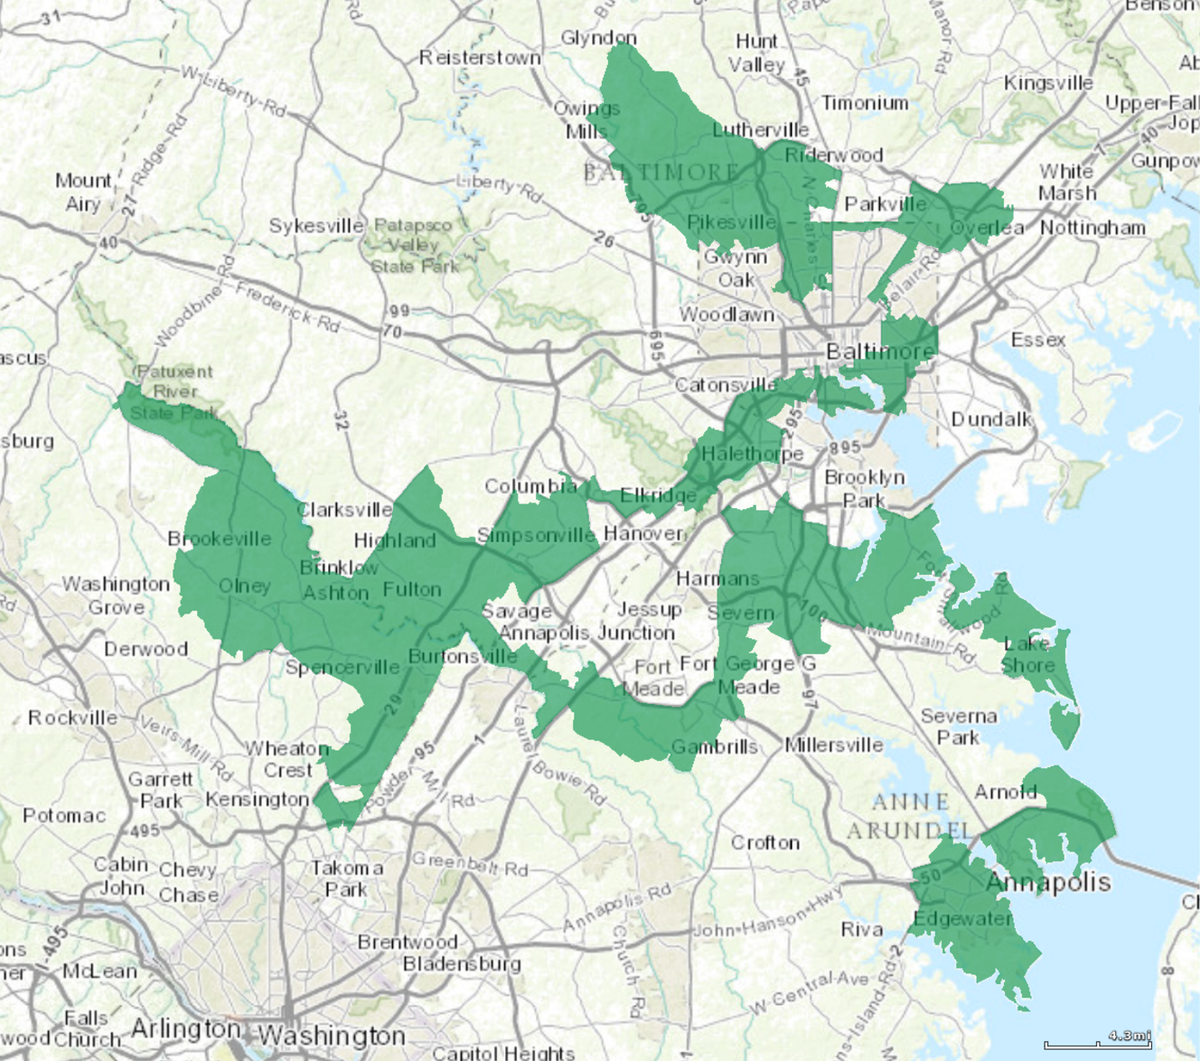
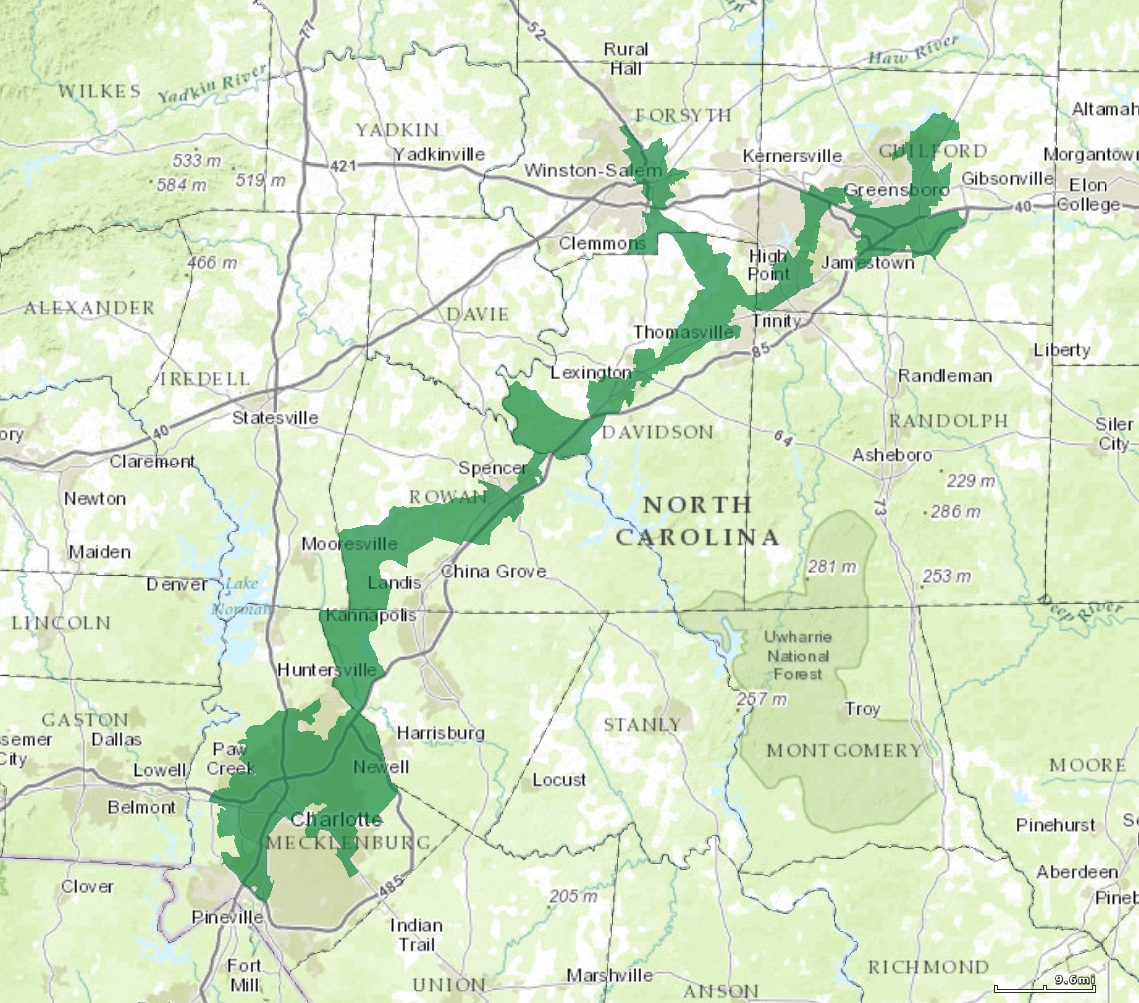
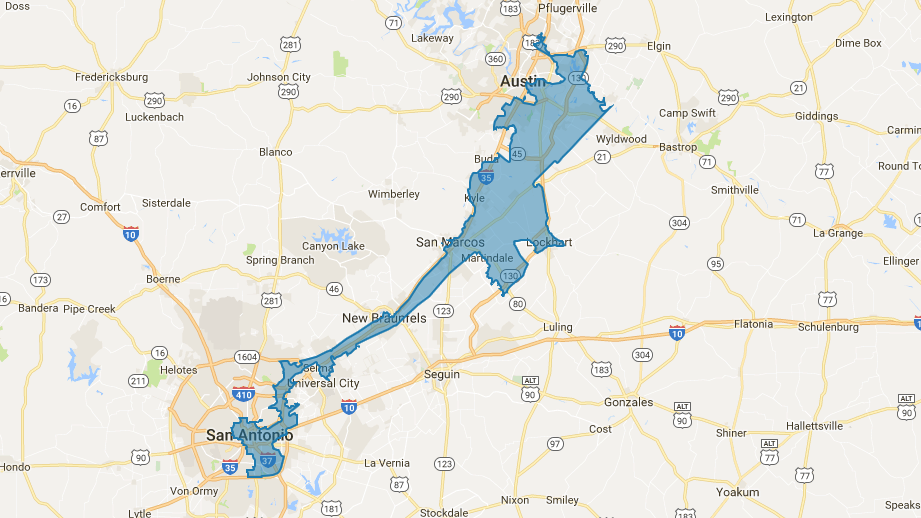
Look at Illinois’s 4th Congressional District — the “earmuff district.” Or North Carolina’s former 12th, a thin strip stretching 120 miles along I-85. Or Texas’s 35th, a ribbon from Austin to San Antonio. No reasonable person would draw these shapes to represent real communities.
Now Look at Map C
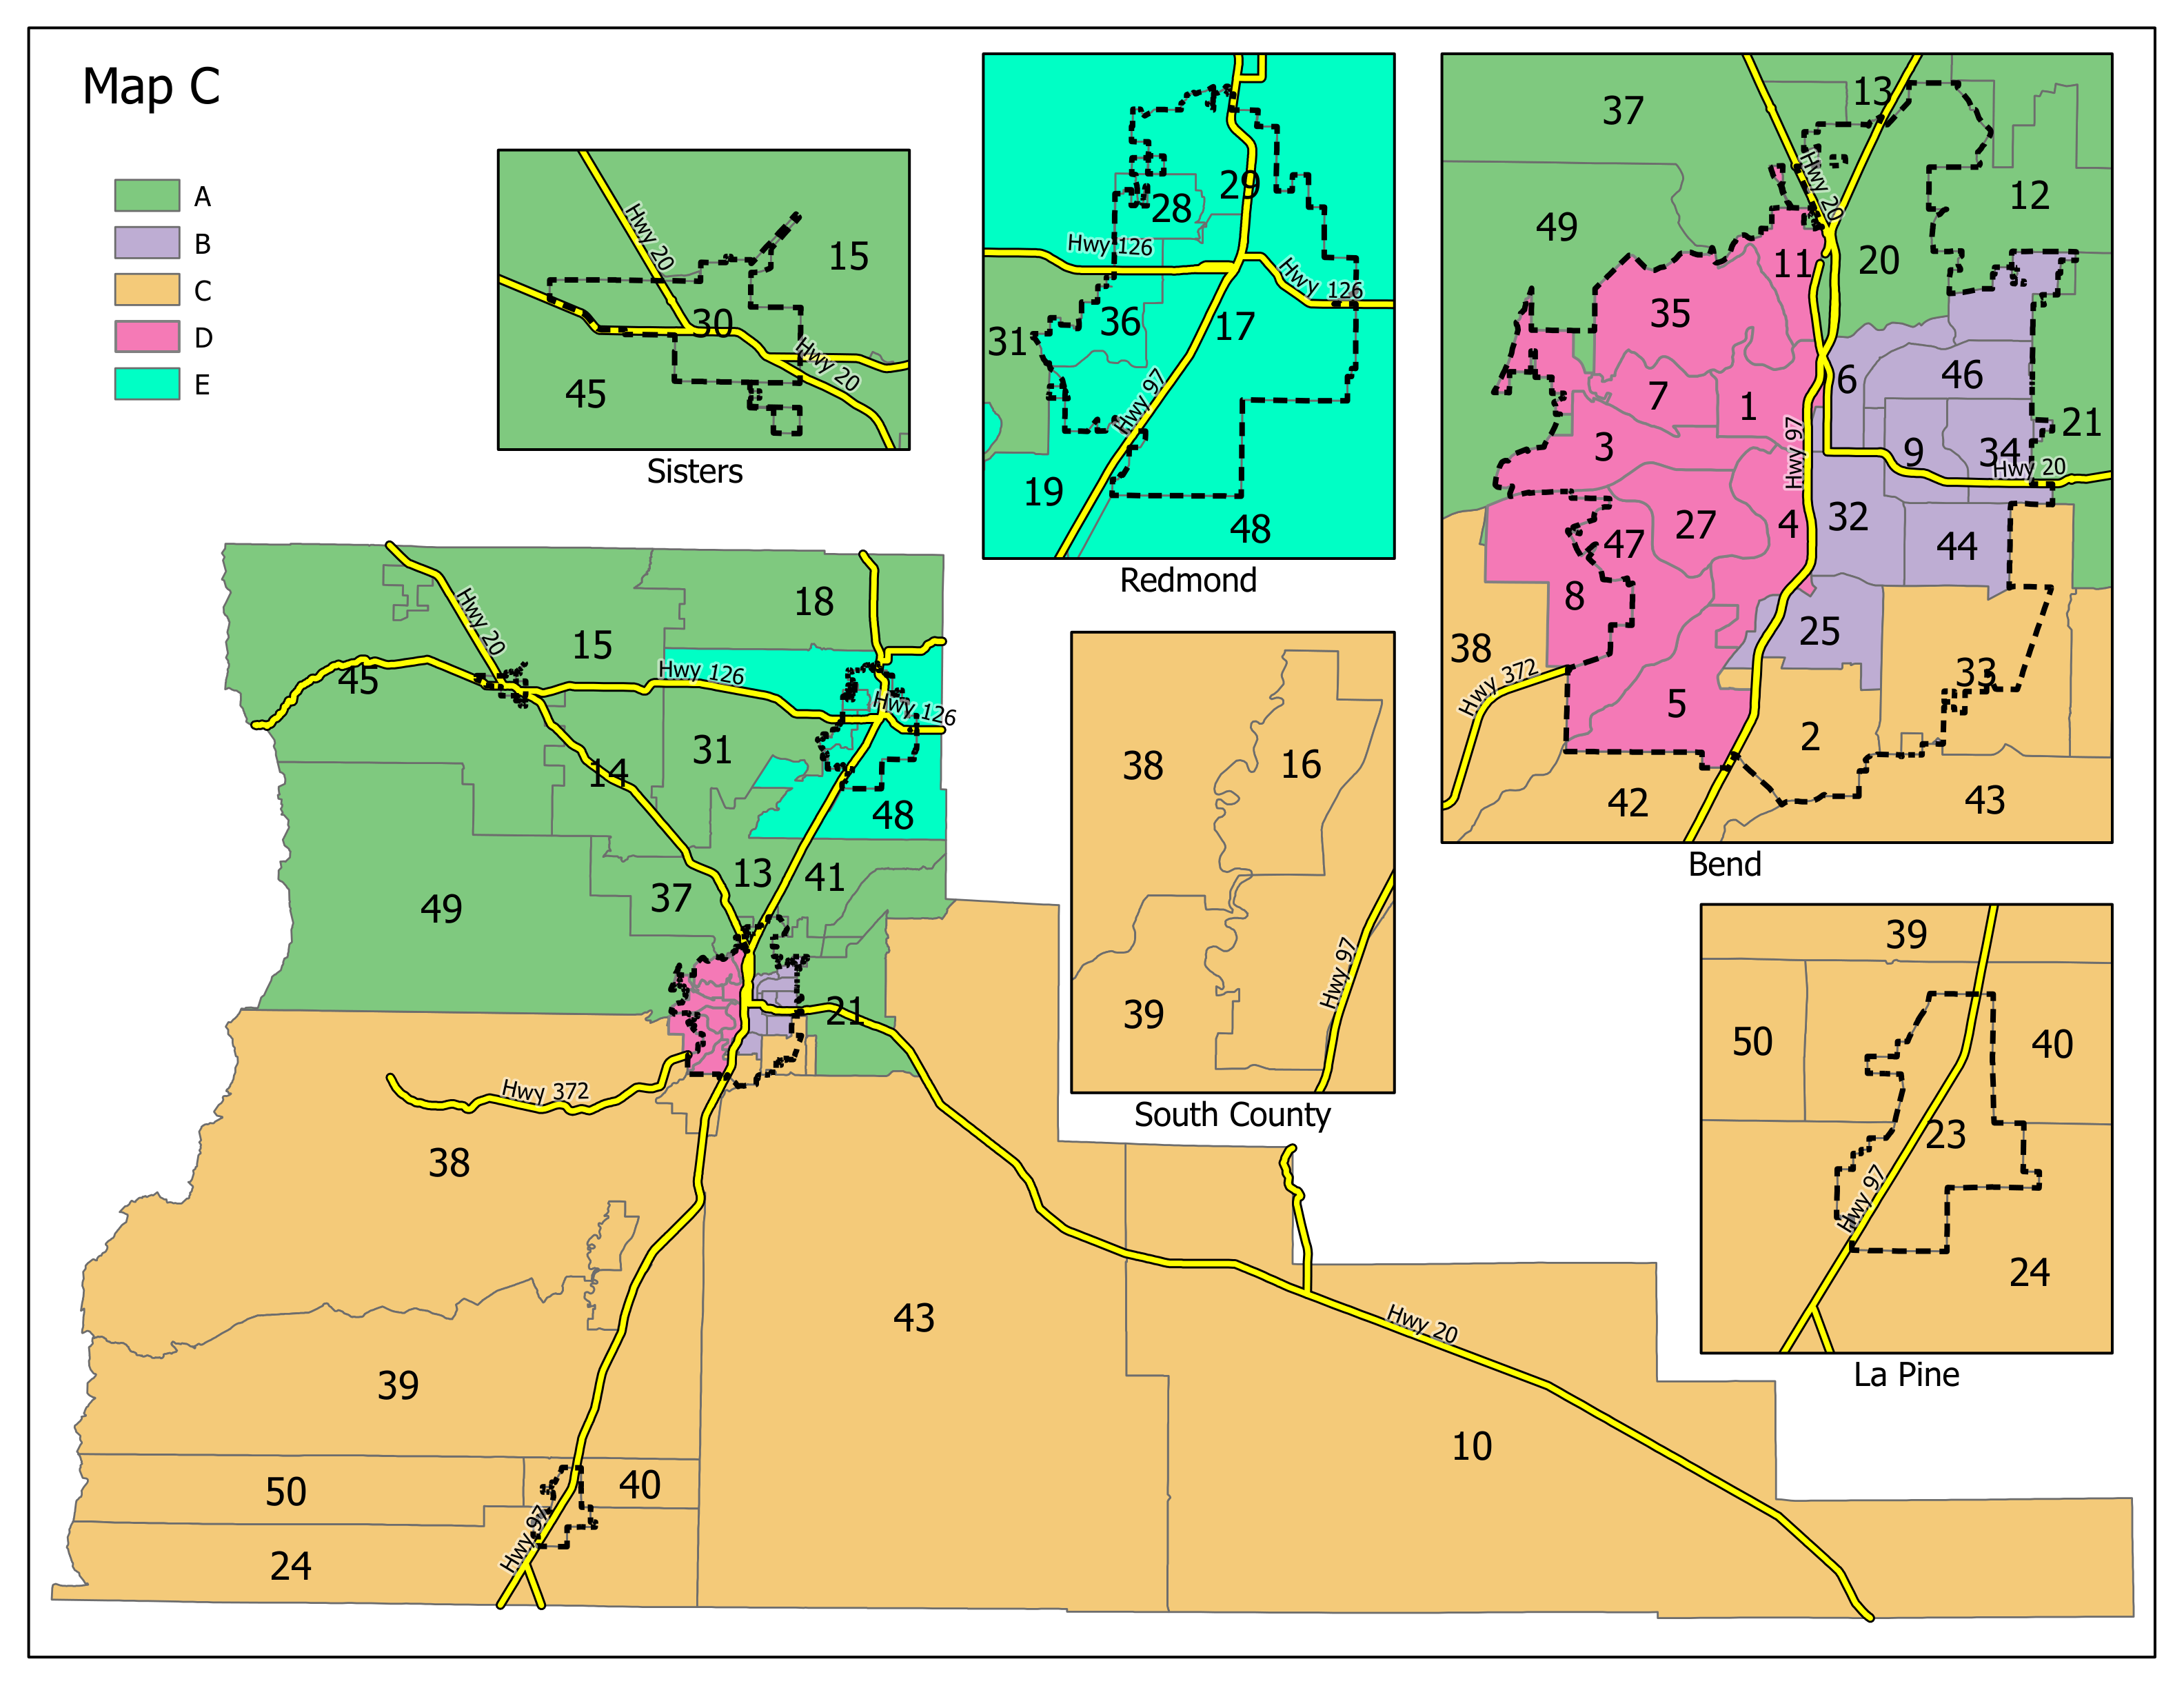
Five compact districts. Each one follows city limits, highway corridors, and the natural landscape of Deschutes County. No tentacles. No earmuffs. No corridors snaking between disconnected areas.
- District A — Sisters and north county. Ranching, agriculture, irrigation, rural roads.
- District B — West Bend. Urban services, housing, transit.
- District C — East Bend. Growth management, neighborhood services.
- District D — Redmond and Terrebonne. Economic development, schools, infrastructure.
- District E — La Pine, Sunriver, and south county. Wildfire, water, emergency services.
Each district represents a real community with real shared needs.
How the Map Was Actually Made
Gerrymandered maps are drawn behind closed doors. Map C was drawn in public.
The committee held twelve meetings over three months. Every meeting was publicly noticed, livestreamed, and recorded under Oregon’s open meeting laws. Meetings rotated through Bend, Sisters, Redmond, and La Pine so no community had to drive an hour to be heard.
The committee included seven voting members appointed by all three commissioners — including three appointed by Commissioner Chang, who voted against the final map. Non-affiliated voters made up 40% of the county’s electorate, and two committee members — Carol Loesche and Neil Bryant — were themselves non-affiliated. The chair, Neil Bryant, reminded the committee at the first meeting that the DMAC “will not be gerrymandering maps.”
The guidelines were clear: districts must be contiguous, follow existing precinct lines, not unreasonably divide communities of common interest, and consider growth patterns. And critically: no district shall be drawn for the purpose of favoring any political party, incumbent elected official, or other person.
Geography First, Partisanship as a Check
Chair Bryant set the approach early: draw maps based on geography and community first. Then check voter registration data at the end to confirm the committee hadn’t inadvertently created a gerrymander. Geography first. Partisanship as a check, not a starting point.
Phil Henderson, a former county commissioner, put it directly: gerrymandering is “when one political party has enough clout to create a map to what they want.” That is not what happened here. The committee debated every decision in public. Maps B and C were identical across 44 of 50 precincts. The remaining differences involved just six precincts, and every adjustment was worked through on-screen with data visible to anyone watching.
When three members later moved to review partisan voter registration data, the motion failed 4-3. The committee then asked County Legal Counsel to attend the next meeting. Legal Counsel’s memo was direct: ORS 188.010 expressly prohibits the use or consideration of data to favor any political party or person.
The Numbers
If Map C were a gerrymander, you’d expect districts carefully engineered to lock in one party’s advantage. Instead:
- The county population was 198,253 in the 2020 Census, with about 164,000 registered voters.
- Bend gets two of five seats — roughly proportional to its share of the county’s population.
- Non-affiliated voters make up 40% of the electorate. No party dominates.
- Every district has a genuine community identity. Sisters ranchers, Redmond families, La Pine residents, and Bend neighborhoods each have distinct needs.
Five other Oregon counties already elect commissioners by district — including Lane County with five districts, and Multnomah County with four districts plus a chair elected at-large. This is mainstream Oregon governance, not a partisan scheme.
The Real Question
Look at the gerrymandered districts one more time. Then look at Map C.
The question isn’t whether a line could have been drawn differently. Lines can always be drawn differently. The question is whether these districts represent real communities, drawn through a fair public process by a committee that followed the rules in the open.
They do.